| |
| Options for User Input (Displayed as above check boxes are checked.) |
|---|
|
|
|
|
|
|
|
| Carbon Removal (Temp Goal) (GtCO2) | | |
| | | | | | |
| Anthro. CO2 Emissions (GTCO2) | | |
| | | | | | | |
| | | | | Total Other CO2e (GtCO2e) | | |
| | | |
| | | | | Carbon Removal Cost Per Ton ($/Ton) | | |
| | | Disaster Costs Per °C ($B/°C) | | |
| |
| | | | | Carbon Removal Cost ($B/Yr) | | |
| | | |
|
|
|
| Gross Anthro. CO2 | GTCO2 | |
|
|
|
|
|
|
|
|
|
|
|
|
|
|
|
|
|
|
- Anthropogenic (human caused) CO2 emissions, including those from the burning of fossil fuels, manufacturing cement, and land use changes
- User can enter values
|
| CO2 - Emissions and Removals |
|
- Anthropogenic (human caused) CO2 emissions, including those from the burning of fossil fuels, manufacturing cement, and land use changes
- User can enter values
|
|
- CCS Carbon capture and storage (CCS) refers to a collection of technologies that remove carbon dioxide (CO2) emissions from industrial processes before they enter the atmosphere. The captured CO2 can either be utilized or stored in the ground.
- Disabled for now
|
|
Additional Information |
|
Today, CCS projects are storing almost 45 million tons of CO2 every year, which is about the amount of CO2 emissions created by 10 million passenger cars. Capture generally takes place at large stationary sources of CO2, like power plants or industrial plants that make cement, steel, and chemicals. Most current carbon capture projects use a liquid to chemically remove the CO2 before it goes out the smokestack, but several new types of capture processes are under development.
The captured CO2 gas is then compressed so it becomes liquid-like and transported to a storage site, generally through a pipeline. Ship transport is more expensive than using pipelines, but it is being considered in both Europe and Japan. Once at the storage site, the CO2 is pumped more than 2,500 feet down wells into geological formations like used-up oil and gas reservoirs, as well as formations that contain unusable, salty water. (https://climate.mit.edu/explainers/carbon-capture)
|
|
|
- Direct air capture (DAC) includes a suite of technologies that remove carbon dioxide (CO2) from the atmosphere using chemical or physical processes
- Disabled for now
|
|
Additional Information |
|
Direct Air Capture (DAC) is a technology designed to remove carbon dioxide (COâ‚‚)
directly from the atmosphere to help mitigate climate change. Unlike other
methods of carbon capture, which focus on emissions from industrial sources, DAC
works by capturing COâ‚‚ that is already in the air.
Here’s how DAC generally works:
- Air Intake: Large fans or other methods pull ambient air into a
system.
- COâ‚‚ Capture: The air passes through a chemical solution or
solid sorbent that binds with the carbon dioxide molecules. There are two
primary types of DAC technologies:
- Liquid-based DAC: Uses chemical solvents that capture COâ‚‚ when
the air passes through.
- Solid-based DAC: Uses solid materials or filters to absorb COâ‚‚.
- COâ‚‚ Release: The captured COâ‚‚ is then isolated from the
material it is bound to, usually through heating or applying a vacuum.
- Storage or Utilization: The COâ‚‚ is either stored underground
(in geological formations like depleted oil fields or deep saline aquifers) or
used in products like synthetic fuels or building materials.
DAC is seen as a potentially important tool for reducing atmospheric COâ‚‚,
especially in cases where it’s not feasible to reduce emissions at the source.
While the technology is still in development, several pilot projects and
commercial operations are working to scale DAC and make it more efficient and
cost-effective. (source: ChatGPT)
|
|
|
- Carbon removal refers to all human derived techniques/process that remove CO2 from the atmopshere (CCS, DAC, mineraliation, etc.)
- User can enter values
|
|
- Cumulative Carbon Removed after the year 2024
- Calcuated: Anthropogenic CO2 emissions after the year 2024
|
|
- Adjustment to CO2 so that the calculated "CO2 PPM" matches the scenario's CO2 PPM value when the scenario's data is first loaded
- Only calcuated when the data for the scenario includes the CO2 PPM
|
|
- Total Anthro CO2
- Calcuated: The sum of all CO2 emissions and removals
|
|
- Cumulative Anthropogenic CO2 emissions after the year 2024
- Calcuated: Cumulative CO2 removed after the year 2024
|
|
- Climate feedbacks refer to processes that can amplify or dampen the effects of climate change. These feedbacks are mechanisms that occur as a result of the changing climate itself and either reinforce or mitigate the initial changes caused by human activities, such as the burning of fossil fuels. (source: ChatGPT)
- User can enter values
|
|
Additional Information |
|
(source: ChatGPT)
|
|
|
- Cumulative FeedbackCO2 emissions after the year 2024
- Calcuated: Cumulative Feedback CO2 emissions after the year 2024
|
|
- Total Net CO2
- Calcuated: The sum of all CO2 emissions and removals
|
|
- Cumulative CO2 emissions after the year 2024
- Calcuated: Cumulative CO2 emissions after the year 2024
|
| CO2 - Atmosphere Calculations |
|
- CO2 emissions added to the atmosphere
- Calculated: based on year, atmospjeric PPM and emissions (details to be added later)
|
|
Additional Information |
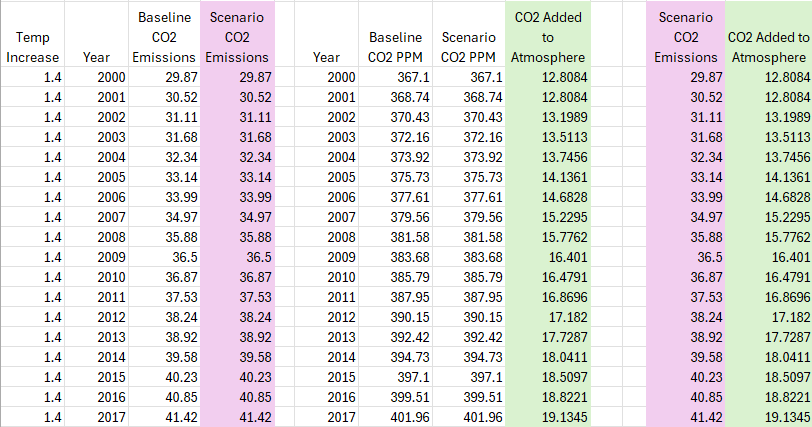
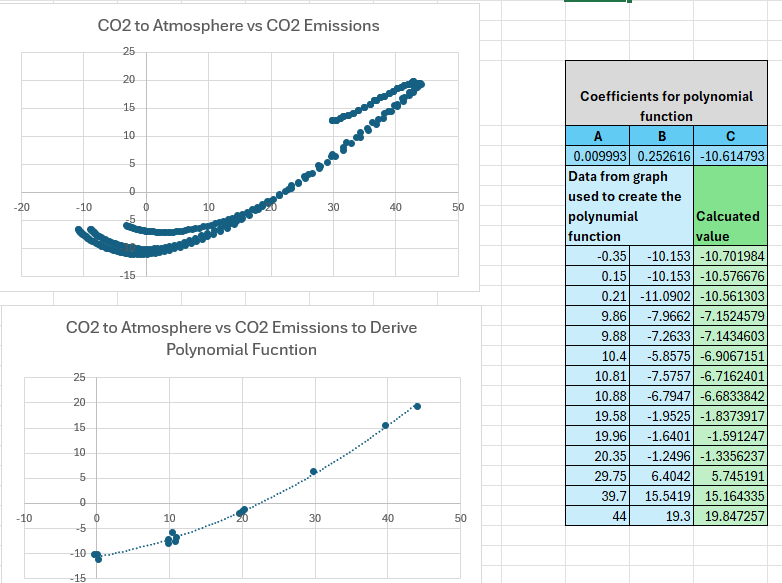
Formula for CO2 Emissions to the Atmosphere
Deriving a formula that relates the CO2 that ends up in the atmosphere to net CO2 emissions
- 1. Used En-ROADs to create three scenarios and copied the Net CO2 Emissions and CO2 PPM data to
a spreadsheet
- 2. The first scenario was for a 1.4°C temperature increase: https://en-roads.climateinteractive.org/scenario.html?v=24.11.0&p1=100&p7=85&p10=5&p16=-0.05&p23=25&p30=-0.07&p35=2&p39=0&p47=5&p50=5&p373=50&p375=50&p63=9&p235=0.5&p60=96&p417=100&p61=100&p67=100
- 3. This scenario was modified slightly to produce two additional scenarios - one with a 1.6°C increase and another with a 1.8°C increase
- 4. The "CO2 Added to Atmosphere" was calculated and graphed as "CO2 to Atmosphere vs CO2 Emissions"
- 5. A "subset" of this data was then used to create a polynomial function that reasonably approximated this graph (see "Coefficients for polynomial function" below)
The formula is: CO2 added to the atmosphere = 0.009993255 * Net CO2 Emissions * Net CO2 Emissions + 0.252616086 * Net CO2 Emissions - 10.6147928
Click here to download a spreadsheet with the data used to create the formula
|
 |
|
 |
|
|
|
- The amount of CO2 added to the atmosphere in 'parts per million' (PPM)
- Calculated: CO2 To Atmosph/7.81
|
|
- The atmospheric concentration of CO2
- Calculated: Previous years's PPM +PPM Added to the atmosphere
|
|
- CO2 emissions absorbed by the land and oceanic sinks. Ocean and land sinks refer to natural processes by which the Earth's oceans and terrestrial ecosystems (such as forests, soils, and wetlands) absorb and store carbon dioxide (CO2) from the atmosphere. These carbon sinks are crucial in regulating the Earth's climate, as they help mitigate the impact of human CO2 emissions, preventing even higher levels of atmospheric CO2 that would otherwise accelerate climate change. (source: ChatGPT)
- Calcuated: total net CO2 - CO2 to atmosphere
|
|
Additional Information |
|
1. Ocean Sinks:
Oceans are one of the largest carbon sinks on Earth, absorbing approximately
25-30% of human-made COâ‚‚ emissions each year.
How the Ocean Absorbs COâ‚‚:
- Physical Pump (Solubility Pump):
- COâ‚‚ dissolves directly into the surface waters of the ocean. As cold water
absorbs COâ‚‚ more efficiently, regions like the polar seas are critical for this
process.
- Once dissolved in the surface ocean, the COâ‚‚ is transported by ocean currents to
deeper layers. This deep ocean storage can last for centuries to millennia,
sequestering COâ‚‚ from the atmosphere for long periods.
- Biological Pump:
- Phytoplankton, tiny plant-like organisms in the ocean, absorb COâ‚‚ from the water
for photosynthesis. When these organisms die, they sink to the ocean floor,
effectively transferring the carbon to deep ocean waters where it can remain for
long periods.
- This process plays a key role in transferring carbon from the surface ocean to
the deep ocean, where it can be sequestered.
- Coastal and Marine Ecosystems:
- Blue Carbon: Coastal ecosystems like mangroves,
salt marshes, and seagrasses are highly
efficient at storing carbon. These areas absorb COâ‚‚ from the atmosphere and
store it in plant biomass and sediment. These ecosystems are especially
important in carbon sequestration due to their high productivity and ability to
trap carbon in waterlogged, low-oxygen conditions that prevent decomposition.
- Coral Reefs: While coral reefs themselves are not large carbon
sinks, they provide a habitat for marine life that plays a role in the marine
carbon cycle.
Challenges and Limitations:
- Ocean Acidification: Increased COâ‚‚ levels in the atmosphere
lead to higher concentrations of dissolved COâ‚‚ in the ocean, which lowers the
ocean’s pH and leads to ocean acidification. This can affect
marine life, particularly organisms that rely on calcium carbonate (like corals
and shellfish), and may reduce the ocean’s ability to absorb more CO₂ over time.
- Reduced Absorption Capacity: Warming of the oceans is slowing
down the carbon absorption capacity. Warmer waters are less efficient at
dissolving COâ‚‚, meaning that as the ocean warms, it may absorb less carbon.
- Overfishing and Ecosystem Damage: Human activity, including
overfishing and habitat destruction, can damage key oceanic ecosystems (like
coral reefs and mangroves), reducing their ability to sequester carbon.
2. Land Sinks:
Land-based carbon sinks include forests, grasslands, soils, and wetlands. These
systems absorb and store significant amounts of carbon through natural processes
like photosynthesis, soil organic matter formation, and plant growth.
How Land Sinks Absorb COâ‚‚:
-
Forests:
- Photosynthesis: Trees and other vegetation absorb COâ‚‚ during
photosynthesis, using it to grow and form biomass (e.g., leaves, branches,
trunks).
- Forests act as large carbon sinks because they cover vast areas of land and have
high carbon-storing capacity, especially in temperate and tropical regions.
- Soil Carbon: Forests also store carbon in the soil, in the form
of decomposed organic matter like dead plants and animals. Soils can hold carbon
for hundreds to thousands of years.
-
Soils:
- Soils are a crucial terrestrial carbon sink, storing more carbon than the
atmosphere and plants combined. Carbon is stored in soil as organic matter,
which results from decaying plants and animals.
- Soil Carbon Sequestration: Sustainable land management
practices, such as no-till farming, cover cropping, and agroforestry, can
enhance the ability of soils to capture and retain carbon.
-
Wetlands:
- Wetlands, including peatlands, mangroves, and marshes, are highly effective at
storing carbon. Waterlogged conditions slow down decomposition, which allows
carbon to accumulate in the form of peat or other organic matter.
- Wetlands are considered blue carbon ecosystems when located
along coastlines (e.g., mangroves, salt marshes).
-
Grasslands and Savannahs:
- Grasslands also sequester carbon through plant growth and soil storage. While
not as significant as forests, they still play an important role in the global
carbon cycle.
Challenges and Limitations:
- Deforestation and Land-Use Change: Deforestation, land clearing
for agriculture, and urbanization release stored carbon back into the
atmosphere. When forests are removed, not only is their carbon storage capacity
lost, but the carbon they have stored in their biomass and soil is often
released.
- Soil Degradation: Practices such as intensive farming,
overgrazing, and deforestation degrade the soil, reducing its carbon storage
potential. Soil erosion and loss of organic matter can decrease its ability to
sequester carbon.
- Climate Change Impacts: Changes in temperature and
precipitation patterns due to climate change can affect the carbon sequestration
capacity of land ecosystems. For example, droughts, fires, and pests can reduce
the carbon storage potential of forests and soils. In some cases, warming soils
may release more COâ‚‚ (a process known as soil respiration),
counteracting the carbon storage benefits.
- Forest Fires: Increased frequency and intensity of forest fires
due to climate change lead to carbon emissions. Forest fires release large
amounts of COâ‚‚ stored in trees and soil into the atmosphere, contributing to a
feedback loop that accelerates warming.
Significance of Ocean and Land Sinks:
- Climate Mitigation: Ocean and land sinks play a key role in
mitigating climate change by absorbing about half of human-made COâ‚‚ emissions
each year. Protecting and enhancing these natural sinks is a critical strategy
for combating global warming.
- Carbon Neutrality and Negative Emissions: Effective use of
carbon sinks is essential for achieving carbon neutrality
(balancing COâ‚‚ emissions with carbon removals) and potentially reaching
negative emissions (removing more COâ‚‚ from the atmosphere than is
emitted).
Future Outlook and Management:
- Enhancing Sinks: Strategies like afforestation, reforestation,
and improved land management (such as agroforestry and sustainable agriculture)
can increase carbon sequestration in land ecosystems. Additionally, restoring
damaged coastal ecosystems like mangroves and salt marshes can enhance blue
carbon storage in oceans.
- Protection of Sinks: Protecting existing forests, wetlands, and
other ecosystems from degradation is equally crucial. This includes enforcing
policies to reduce deforestation, prevent land-use change, and protect marine
ecosystems from damage.
- Carbon Capture and Storage (CCS): While not strictly a "natural
sink," CCS technologies are being developed to artificially capture and store
carbon from the atmosphere or industrial sources, potentially augmenting both
ocean and land-based carbon sequestration efforts.
Conclusion:
Ocean and land sinks are vital in helping to moderate the impacts of climate
change by absorbing and storing large amounts of COâ‚‚ from the atmosphere.
Protecting and enhancing the capacity of these sinks is essential to any climate
strategy aimed at limiting global warming. However, their effectiveness is
limited by factors like land-use change, ocean acidification, and the impacts of
climate change on ecosystems. (source: ChatGPT)
|
|
|
- The airborne fraction (AF) refers to the portion of carbon dioxide (CO2) emitted into the atmosphere that remains in the atmosphere, rather than being absorbed by natural carbon sinks such as oceans, forests, and soils. In simpler terms, it is the fraction of CO2 emissions that do not get sequestered by these natural systems and therefore contribute to the accumulation of atmospheric CO2, which is a primary driver of climate change. (source:ChatGPT) (Note: a value is not displayed if 'total net CO2 emissions are zero or less)
- Calcuated: CO2 to atmosphere/total net CO2
|
|
Additional Information |
|
Formula: Airborne Fraction = CO2 Added to Atmpshere/Total CO2 Emissions
Key Points:
- The airborne fraction represents the ratio of the COâ‚‚ that stays in the
atmosphere after emission.
- It is influenced by the ability of carbon sinks (such as
forests, oceans, and soils) to absorb COâ‚‚. If carbon sinks are efficient, the
airborne fraction will be lower because a greater proportion of the emitted COâ‚‚
will be absorbed.
- Over time, the airborne fraction can change based on factors like:
- Land use and forest management practices.
- Ocean health, particularly how much COâ‚‚ the oceans can absorb.
- Climate and weather patterns, which can influence carbon sink
efficiency.
Historical Trends:
- Historically, the airborne fraction has increased over time. This means that a
growing proportion of the COâ‚‚ emissions caused by human activities (such as
burning fossil fuels) is staying in the atmosphere, contributing to the rise in
global temperatures.
- For example, between 1959 and 2019, the airborne fraction has risen from about
40% to around 45% of the total COâ‚‚ emissions, indicating that natural carbon
sinks (e.g., forests, oceans) have not been able to absorb as much COâ‚‚ as they
did in the past, partly due to factors like deforestation and ocean
acidification.
Factors Influencing the Airborne Fraction:
-
Capacity of Carbon Sinks:
- The Earth’s natural systems, like forests, soil, and oceans, act as
carbon sinks that absorb a significant amount of the emitted COâ‚‚.
However, their capacity to absorb COâ‚‚ can vary over time.
- Ocean acidification and deforestation are two
significant factors that can reduce the efficiency of these carbon sinks,
leading to a higher airborne fraction.
- Forest degradation and reduced vegetation also lower the
capacity for COâ‚‚ uptake.
-
Emissions Trends:
- The rate of COâ‚‚ emissions has increased sharply, particularly
since the industrial revolution. Higher emissions mean that, even if sinks
remain stable, the absolute amount of COâ‚‚ that stays in the atmosphere
increases.
-
Climate Change Feedbacks:
- Warming temperatures may reduce the efficiency of natural
carbon sinks. For example, warmer oceans are less efficient at absorbing COâ‚‚,
and warmer temperatures can increase the release of COâ‚‚ from soils and
permafrost.
- Forest fires, droughts, and other extreme
weather events can disrupt the ability of ecosystems to absorb COâ‚‚.
Why the Airborne Fraction Matters:
- Climate Change Impact: The airborne fraction is a critical
metric for understanding how much of human COâ‚‚ emissions are contributing to the
greenhouse effect and, by extension, to climate change. As the airborne fraction
increases, more COâ‚‚ stays in the atmosphere, leading to faster global warming.
- Policy and Mitigation: Knowing the airborne fraction helps
inform climate policy and mitigation strategies. If the airborne fraction is
high, there may be a greater need for carbon removal technologies
(e.g., afforestation, direct air capture) to offset emissions that are not being
absorbed by natural sinks.
- Carbon Budget: The concept of a carbon budget
is closely related to the airborne fraction. It refers to the total amount of
COâ‚‚ that can be emitted into the atmosphere before global temperature rises
beyond a certain threshold, typically 1.5°C or 2°C above pre-industrial levels.
As the airborne fraction increases, it reduces the amount of COâ‚‚ that can be
emitted before exceeding these temperature limits.
Conclusion:
The airborne fraction is a vital measure of the effectiveness
of Earth’s natural carbon sinks in absorbing the CO₂ the humans emit. As this fraction
increases, it signals that more of our emissions are staying in the atmosphere,
contributing to the intensification of climate change. Monitoring and reducing
the airborne fraction by enhancing carbon sinks and adopting mitigation
strategies is crucial for limiting global warming and stabilizing the climate.
(source: ChatGPT)
|
|
|
- The radiative forcing of CO2 (in W/m-2)
- Calculated: log(CO2 PPM / PreIndustrial PPM) * 5.35
|
|
Additional Information |
|
(source: ChatGPT)
|
|
|
- The radiative forcing of CH4 (methane). Methane (CH4) is a potent greenhouse gas and the primary component of natural gas. It is colorless, odorless, and highly flammable. While methane is less abundant than carbon dioxide (CO2) in the atmosphere, it has a much higher global warming potential (GWP) over a short time frame, making it a critical factor in global climate change.(source: ChatGPT)
- User can enter values; if no values entered then values based on 'aggressiveness' of mitigation selection
|
|
Additional Information |
Key Characteristics of Methane (CHâ‚„):
- Chemical Formula: CHâ‚„ consists of one carbon atom bonded to
four hydrogen atoms.
- Physical Properties: Methane is lighter than air and is the
simplest and most abundant of the alkanes (a type of hydrocarbon).
- Sources: Methane is released naturally and anthropogenically
(human-caused). Its sources include:
- Natural Sources:
- Wetlands (such as peatlands and swamps), where organic matter decays
anaerobically (without oxygen).
- Termites and other organisms involved in the decomposition of organic matter.
- Oceans and freshwater bodies, where microorganisms break down organic material
in oxygen-deprived environments.
- Anthropogenic (Human-Caused) Sources:
- Fossil fuel extraction: Methane is released during the
extraction, processing, and transportation of coal, oil, and natural gas.
- Agriculture: Livestock, especially ruminants like cattle,
produce methane during digestion through a process called enteric
fermentation. Rice paddies also emit methane due to the anaerobic
conditions in flooded fields.
- Landfills: Decomposing organic waste in landfills produces
methane.
- Wastewater treatment: Methane is released during the treatment
of wastewater, especially in anaerobic conditions.
- Biomass burning: The incomplete combustion of organic materials
can result in methane emissions.
Global Warming Potential of CHâ‚„:
-
High Global Warming Potential (GWP): While methane is present
in much lower concentrations than COâ‚‚, it is significantly more effective at
trapping heat in the atmosphere. Over a 20-year period, methane has a
GWP of around 84-87 times that of COâ‚‚, and over a 100-year period, its
GWP is approximately 28-36 times that of COâ‚‚. This means that,
molecule for molecule, methane is far more potent at warming the planet than
COâ‚‚, especially in the short term.
-
Atmospheric Lifetime: Methane has a relatively short
atmospheric lifetime of about 12 years, compared to COâ‚‚'s much
longer lifespan (hundreds to thousands of years). This makes reducing methane
emissions an effective way to achieve near-term climate benefits.
Environmental Impact of Methane (CHâ‚„):
- Contribution to Climate Change:
- Methane is a significant greenhouse gas and a major contributor to
global warming. Although it stays in the atmosphere for a shorter time
than COâ‚‚, its potency means it has a large impact on the climate system,
especially in the near term.
- Methane contributes to the formation of tropospheric ozone, a
potent greenhouse gas that further exacerbates climate change.
- Methane as a Short-Lived Climate Pollutant (SLCP):
- Methane is classified as a short-lived climate pollutant (SLCP)
because of its short atmospheric lifetime. Reducing methane emissions is
considered one of the most effective strategies for limiting near-term warming.
Mitigation of Methane Emissions:
Efforts to reduce methane emissions are critical in addressing both short-term
and long-term climate change. Key strategies include:
-
Reducing Fossil Fuel Emissions:
- Leak Detection and Repair: Preventing methane leaks during the
extraction, processing, and transportation of natural gas is crucial.
Technologies like infrared cameras and sensors can help detect methane leaks.
- Flare or Capture Methane: Instead of flaring methane (burning
it off), capturing and utilizing methane for energy (e.g., methane
recovery from landfills or wastewater treatment plants) can reduce its
environmental impact.
-
Agricultural Mitigation:
- Improving Livestock Management: Methane emissions from ruminant
animals can be reduced through dietary changes (such as feeding livestock more
efficiently) or through the use of additives that reduce methane production
during digestion.
- Rice Paddy Management: Reducing the amount of water used in
rice paddies (which reduces anaerobic conditions) and implementing better
farming practices can lower methane emissions from rice cultivation.
-
Waste Management:
- Landfill Gas Capture: Methane can be captured from landfills
through gas collection systems and used as an energy source,
thus preventing it from escaping into the atmosphere.
- Wastewater Treatment: Methane emissions from wastewater
treatment facilities can be reduced by optimizing treatment processes or
capturing the methane for energy generation.
-
Policy and Regulation:
- Governments and international organizations are increasingly adopting
regulations aimed at reducing methane emissions. This includes commitments under
agreements like the Global Methane Pledge, which aims to reduce
methane emissions by 30% by 2030 (from 2020 levels).
- The Kigali Amendment to the Montreal Protocol
also includes provisions for controlling methane emissions associated with
refrigeration and air conditioning systems.
Future Outlook:
- Increasing Focus on Methane Reduction: As the understanding of
methane's contribution to climate change grows, there is increasing emphasis on
reducing methane emissions, especially as it is one of the most cost-effective
strategies for mitigating near-term warming.
- Technology Development: New technologies are emerging to
capture methane more efficiently, both from industrial sources and in the
agricultural sector. Methane digesters, for example, can
capture methane from manure and convert it into biogas, which can then be used
for energy.
- Shifting to Renewable Energy: Reducing reliance on fossil fuels
and transitioning to renewable energy sources like wind, solar,
and hydroelectric power will help decrease methane emissions, particularly those
from the natural gas industry.
Conclusion:
Methane (CHâ‚„) is a potent greenhouse gas that plays a significant role in global
warming, particularly in the short term. While methane emissions come from both
natural and human sources, the latter (especially fossil fuel extraction,
agriculture, and waste management) present the largest opportunities for
mitigation. Reducing methane emissions is a key strategy for addressing climate
change and limiting global warming, with significant benefits for both
short-term and long-term climate goals. Efforts to reduce methane emissions are
becoming a priority in international climate policy and industry practices.
(source: ChatGPT)
|
|
|
- The radiative forcing of N2O(in W/m-2). Nitrous oxide (N2O), commonly known as laughing gas, is a potent greenhouse gas and an ozone-depleting substance. It occurs naturally in the environment but is also significantly produced by human activities, particularly in agriculture and industrial processes. N2O is an important compound in the context of both climate change and stratospheric ozone depletion.(source: ChatGPT)
- User can enter values; if no values entered then values based on 'aggressiveness' of mitigation selection
|
|
Additional Information |
Key Characteristics of Nitrous Oxide (Nâ‚‚O):
- Chemical Formula: Nâ‚‚O consists of two nitrogen atoms (N) and
one oxygen atom (O).
- Physical Properties: It is colorless, non-flammable, and has a
slightly sweet odor. Nâ‚‚O is commonly used in medicine as an anesthetic and pain
reliever, and as a propellant in aerosol products.
- Sources: Nâ‚‚O is emitted both from natural and anthropogenic
(human-caused) sources.
Natural Sources of Nâ‚‚O:
- Soils: The largest natural source of Nâ‚‚O is the
microbial processes that occur in soils, particularly in
wetlands, where microbes break down nitrogen compounds under anaerobic
(low oxygen) conditions. These microbes produce Nâ‚‚O as a byproduct.
- Oceans: Oceans also contribute a smaller amount of Nâ‚‚O,
primarily due to microbial processes in coastal and marine ecosystems.
- Forests and Grasslands: Natural nitrogen cycles in forests and
grasslands can produce small amounts of Nâ‚‚O, mainly through soil microbes.
Anthropogenic Sources of Nâ‚‚O:
Human activities are responsible for the vast majority of the Nâ‚‚O emissions in
the atmosphere. The main sources include:
-
Agriculture:
- Fertilizer Use: The most significant anthropogenic source of
Nâ‚‚O comes from the use of synthetic nitrogen fertilizers. When fertilizers are
applied to soil, microbes in the soil convert the nitrogen in the fertilizers
into various forms, including Nâ‚‚O, through processes like nitrification
and denitrification.
- Manure Management: Livestock farming also contributes to Nâ‚‚O
emissions. The decomposition of animal manure, particularly in wet conditions,
results in the production of Nâ‚‚O.
-
Fossil Fuel Combustion: The burning of fossil fuels, especially
in cars and industrial processes, releases small amounts of Nâ‚‚O into the
atmosphere. Nâ‚‚O is produced during the combustion of fuel containing nitrogen
impurities.
-
Industrial Processes: Some industrial activities, such as the
production of nylon and nitric acid, release Nâ‚‚O as a byproduct.
-
Waste Treatment: Wastewater treatment plants, particularly
those dealing with nitrogen-rich waste, can produce Nâ‚‚O emissions during the
microbial treatment of the waste.
Environmental Impact of Nâ‚‚O:
-
Global Warming Potential (GWP):
- Nâ‚‚O is a potent greenhouse gas, with a GWP
around 298 times that of COâ‚‚ over a 100-year period. This means
that, molecule for molecule, Nâ‚‚O has a significantly higher heat-trapping
potential than COâ‚‚.
- Although Nâ‚‚O is present in the atmosphere in much smaller quantities than COâ‚‚,
its high GWP makes it a major concern for climate change.
-
Ozone Depletion:
- Nâ‚‚O is also an ozone-depleting substance. When it reaches the
stratosphere, Nâ‚‚O is broken down by ultraviolet (UV) radiation, releasing
nitrogen oxides (NOâ‚“), which then contribute to the destruction of ozone
molecules in the stratosphere. The ozone layer protects life on Earth by
blocking harmful UV radiation.
- Nâ‚‚O is considered the most significant ozone-depleting substance that is
not controlled by the Montreal Protocol, a treaty designed to phase out
ozone-depleting chemicals like CFCs.
Mitigation of Nâ‚‚O Emissions:
Reducing Nâ‚‚O emissions is important for both mitigating climate change and
protecting the ozone layer. Some strategies to reduce Nâ‚‚O emissions include:
-
Agricultural Practices:
- Efficient Fertilizer Use: Reducing excess nitrogen fertilizer
use is one of the most effective ways to cut Nâ‚‚O emissions. This can be achieved
through better fertilizer management practices, including precision farming,
which applies the right amount of fertilizer at the right time.
- Improved Manure Management: Techniques such as anaerobic
digestion, where manure is processed to produce biogas, can reduce Nâ‚‚O emissions
from livestock farming.
- Cover Cropping: Planting cover crops during off-seasons can
help to absorb nitrogen in the soil, reducing the potential for Nâ‚‚O emissions
when fertilizers are applied.
- Nitrification Inhibitors: Certain chemicals known as
nitrification inhibitors can be added to soils to slow down the conversion of
nitrogen to Nâ‚‚O, thereby reducing emissions.
-
Reducing Industrial Emissions:
- Cleaner Industrial Technologies: Modifying industrial processes
to reduce the production of Nâ‚‚O, such as in the production of nitric acid and
nylon, can help cut emissions from these sectors.
- Waste Treatment Improvements: Optimizing wastewater treatment
technologies to minimize Nâ‚‚O production can reduce emissions from this source.
-
Policy and Regulation:
- Governments can implement regulations and policies that promote
sustainable agricultural practices, encourage energy efficiency,
and require emission reductions from industrial sectors. These
measures can help limit the amount of Nâ‚‚O released into the atmosphere.
-
Alternative Nitrogen Fertilizers:
- Developing and using fertilizers with lower nitrogen content or
that are more efficient in the soil can help decrease Nâ‚‚O
emissions. Some alternatives, such as controlled-release fertilizers,
release nutrients more gradually, reducing the potential for Nâ‚‚O formation.
Conclusion:
Nitrous oxide (Nâ‚‚O) is a powerful greenhouse gas and an important contributor to
both global warming and ozone depletion. While
natural sources of Nâ‚‚O exist, human activities, particularly agriculture, are
the primary drivers of its emissions. Addressing Nâ‚‚O emissions is crucial for
mitigating climate change and protecting the ozone layer. Strategies to reduce
emissions include better agricultural practices, improved waste management, and
cleaner industrial technologies. By targeting Nâ‚‚O emissions, significant progress can be made in the efforts to address climate change and environmental
protection.
(source: ChatGPT)
|
|
|
- The radiative forcing from all of greenhouse gases other than the ones listed above (in W/m-2)
- Disabled for now
|
|
- The radiative forcing of all of the greenhouse gases (in W/m-2)
- Calculated: Sum of the above RFs
|
|
- The radiative forcing from aerosols (in W/m-2). Aerosols are tiny solid or liquid particles suspended in the atmosphere. They can originate from both natural sources and human activities. Aerosols play a crucial role in the Earth's climate system and can have significant effects on air quality, weather patterns, and the global climate.(source: ChatGPT)
- User can enter values; if no values entered then values based on 'aggressiveness' of mitigation selection
|
|
Additional Information |
Types of Aerosols:
-
Natural Aerosols:
- Sea Spray: Tiny droplets of seawater that are released into the
air when waves break on the ocean's surface. These aerosols can contribute to
cloud formation and influence the Earth's radiation balance.
- Dust: Fine particles of soil and sand, often from deserts, that
are lifted into the atmosphere by wind. Dust aerosols can affect air quality,
cloud formation, and regional climate.
- Volcanic Ash: Particles released during volcanic eruptions.
Volcanic aerosols, such as sulfur dioxide (SOâ‚‚), can remain in the atmosphere
for months or even years, affecting global temperatures and air quality.
- Biological Aerosols: Particles released by plants, fungi, and
bacteria, including pollen, spores, and microorganisms. These can affect air
quality and human health, and in some cases, influence cloud formation.
-
Anthropogenic (Human-made) Aerosols:
- Industrial Emissions: Aerosols produced by burning fossil fuels
in power plants, factories, and vehicles. These aerosols often contain
pollutants such as sulfur dioxide (SOâ‚‚), nitrogen
oxides (NOx), and black carbon (soot).
- Aerosols from Biomass Burning: Wood, crop waste, and other
organic materials are burned for heating, cooking, or land clearing. These fires
release particulate matter, including carbon-based aerosols, into the
atmosphere.
- Aerosols from Agriculture: Dust and chemicals used in
agricultural practices, such as pesticides or fertilizers, can also form
aerosols that enter the atmosphere.
- Aerosols from Urbanization: The expansion of cities can release
large amounts of aerosols from construction, transportation, and industrial
processes.
Effects of Aerosols on the Climate:
Aerosols can influence the climate in several ways, both directly
(by affecting the Earth's radiation balance) and indirectly (by
modifying cloud properties).
-
Direct Effect:
- Aerosols reflect, absorb, or scatter sunlight, which can alter the amount of
solar energy reaching the Earth's surface. For example:
- Reflecting Aerosols (such as sulfates and sea spray) can
cool the Earth's surface by reflecting sunlight back into
space. This can reduce global temperatures.
- Absorbing Aerosols (such as black carbon) can warm the
atmosphere by absorbing sunlight and radiating heat.
- The net effect of aerosols on climate depends on their composition, size, and
altitude.
-
Indirect Effect:
- Aerosols can influence cloud formation and cloud
properties. For example:
- Cloud Condensation Nuclei (CCN): Aerosols act as nuclei around
which water droplets form to create clouds. An increase in aerosols can lead to
clouds with more droplets but smaller sizes, making the clouds
more reflective and potentially cooling the Earth's surface.
- Cloud Lifetime: Aerosols can also affect the lifetime
and extent of clouds. More aerosols may lead to more persistent
clouds that could affect regional weather patterns and rainfall.
- These aerosol-induced changes in cloud properties can affect regional and global
weather, rainfall patterns, and atmospheric circulation.
Impact on Weather and Air Quality:
- Air Pollution: Aerosols can be harmful to human health. Small
particles, particularly PM2.5 (particles smaller than 2.5
micrometers), can penetrate deep into the lungs and cause respiratory and
cardiovascular diseases.
- Visibility: Aerosols in the atmosphere, especially from
industrial pollution or wildfires, can reduce visibility and
create hazy conditions. This can affect both urban and rural areas.
- Acid Rain: Some aerosols, particularly those containing sulfur
compounds, can combine with water vapor to form acid rain,
which harms ecosystems, crops, and buildings.
Aerosols and Climate Feedbacks:
Aerosols can be involved in climate feedback mechanisms. For
example:
- Amplification of Warming: As aerosols cause the melting of ice
or snow by lowering the Earth's albedo (reflectivity), the loss of ice
cover can expose darker surfaces beneath (such as ocean or land), which
absorb more heat and further accelerate warming.
- Reduced Effectiveness of Some Climate Mitigation: Aerosols like
sulfates can temporarily mask some effects of global warming, but they do not
solve the underlying problem of greenhouse gas emissions. Reducing
aerosol emissions (such as through cleaner technologies) might result
in short-term warming, even if greenhouse gases are being reduced.
Sources of Aerosols:
- Natural Sources:
- Volcanic eruptions
- Wildfires
- Dust storms
- Ocean spray (sea salt)
- Plant material and biogenic aerosols (like pollen)
- Anthropogenic (Human-caused) Sources:
- Combustion of fossil fuels (e.g., from vehicles and power plants)
- Industrial processes (e.g., cement and metal production)
- Agriculture (e.g., burning of biomass and pesticide use)
- Residential heating and cooking
Aerosols and Global Warming:
Aerosols can influence global warming by either cooling or
warming the Earth’s climate:
- Cooling Effect: Aerosols that reflect sunlight (like sulfate
aerosols) can offset some of the warming caused by greenhouse gases, but this
effect is limited and temporary.
- Warming Effect: Aerosols that absorb sunlight (like black
carbon) can warm the atmosphere and contribute to regional climate changes,
especially in sensitive areas like the Arctic.
Challenges in Climate Modeling:
The effects of aerosols on climate are complex and not yet fully understood. The
following factors make it difficult to quantify the exact impact of aerosols:
- Aerosols are highly variable in space and time.
- The way aerosols interact with clouds and sunlight is still being researched.
- Aerosols have both direct and indirect
effects, which complicates predictions.
Conclusion:
Aerosols play a significant role in both climate and air quality.
They can have both cooling and warming effects
on the Earth's climate, primarily through their interaction with sunlight and
clouds. While natural sources contribute significantly to aerosol levels, human
activities, particularly industrial emissions and fossil fuel burning, are key
contributors to aerosol pollution. Their impact on climate change is an area of
ongoing research, as understanding the complexities of aerosols is crucial for
improving climate models and addressing air quality issues.
(source: ChatGPT)
|
|
|
- The total radiative forcing (in W/m-2)
- Calculated: Sum of all the above RFs
|
|
- The total radiative forcing (in W/m-2)
- Calculated: Sum of all the above RFs
|
|
- Total CO2 emissions (listed above but included in this list all the CO2e factors)
- Same as 'Total net CO2' emissions
|
|
- CO2-equivelent CO2e) emissions from methane (CH4)
- Calculated: 'Total net CO2' * CH4 RF/ CO2 RF
|
|
- CO2-equivelent CO2e) emissions from N2O
- Calculated: 'Total net CO2' *N2O RF/ CO2 RF
|
|
- CO2-equivelent CO2e) emissions from all of the greenhouse gases except CO2, CH2, and N2O
- Calculated: 'Total net CO2' * Total Other RF/CO2 RF
|
|
- CO2-equivelent CO2e) emissions from all of the greenhouse gases
- Disabled for now
|
|
- CO2-equivelent CO2e) emissions from aerosols
- Calculated: 'Total net CO2' * Aerosol RF/CO2 RF
|
|
- The total of all CO2 and CO2-equivelent CO2e) emissions
- Calculated: 'Total net CO2' * Total RF/CO2 RF
|
| Radiative Forcing Coeff (ΔTemperature/ΔRadiative Forcing) and Temperature Increase |
|
- The ratio of the change in temperature to the change in radiative forcing for the specific year - the "radiative forcing factor" (RFF)
- Calculated: Value based formula derived from IPCC data. The ratio of the temperature increase (for a 67% chance of not exceeding the carbon budget) to the total radiative forcing was calculated for all model runs. For each five-year period from 2030 through 2100 a liner equation (with coefficients A and B) relating atmospheric CO2 PPM to the ratio was derived. Two polynomial equations, one for each coefficient based on the ratio for each five year period, were then derived. The various equations were then combined to produce the following formula:
CF=(-2.07932167252698E-07 * YEAR * YEAR +0.000871260688455337 * YEAR - 0.912804514777875) * CO2 PPM + (0.0000636483061382873 * YEAR * YEAR - 0.266585156783745 * YEAR +279.779588212216)
|
|
Additional Information |
Climate Factor Calculations
Data from most of the model runs used by the IPCC for the AR6 Reports were used to create a formula that the Scenario Explorer uses to calculate the "Climate Factor"
- the ratio of the temperature increase to total radiaive forcing based on the atmospheric concentration of CO2 and the total radiative forcing.
The temperature increase for a given year is then simple equal to the "Climate Factor" times the total radiaive forcing.
Figure 1 shows some of the IPCC data (in the "Data from IPCC AR6" columns) and the corresponding calculations.
|
Data from IPCC AR6 |
Calculations |
|
Model Scenario ID |
Year |
CO2 PPM |
RF |
Temp Increase |
Climate Facator (Temp/RF) |
Calculated
CF Value |
Difference |
|
572 |
2030 |
415.0418 |
2.9060 |
1.3931 |
0.4794 |
0.4796 |
0.0002 |
|
574 |
2030 |
420.5679 |
2.9918 |
1.4081 |
0.4707 |
0.4740 |
0.0033 |
|
407 |
2030 |
420.7796 |
2.9917 |
1.4102 |
0.4714 |
0.4738 |
0.0024 |
|
230 |
2030 |
422.1964 |
3.2164 |
1.4633 |
0.4549 |
0.4723 |
0.0174 |
|
229 |
2030 |
422.2136 |
3.2156 |
1.4629 |
0.4549 |
0.4723 |
0.0174 |
|
232 |
2030 |
422.2136 |
3.2156 |
1.4629 |
0.4549 |
0.4723 |
0.0174 |
|
425 |
2030 |
422.4094 |
3.0284 |
1.4183 |
0.4683 |
0.4721 |
0.0038 |
|
423 |
2030 |
422.4538 |
3.0309 |
1.4187 |
0.4681 |
0.4721 |
0.0040 |
|
676 |
2030 |
422.9494 |
3.1579 |
1.4550 |
0.4607 |
0.4716 |
0.0108 |
Figure 1. Sample IPCC Data and Calculations
|
| The formula was derived as follows: |
| For each-year divisible by 5, the "A" and "B" coefficients for a linear equation relating the temperature increase to the total radiative forcing were derived: |
|
Year |
A |
B |
|
2030 |
-0.00092 |
0.85085286 |
|
2035 |
-0.00097 |
0.90201142 |
|
2040 |
-0.00082 |
0.84894730 |
|
2045 |
-0.00069 |
0.81353166 |
|
2050 |
-0.00054 |
0.75888388 |
|
2055 |
-0.00037 |
0.70512854 |
|
2060 |
-0.00037 |
0.70512854 |
|
2065 |
-0.00031 |
0.68610271 |
|
2070 |
-0.00027 |
0.67275039 |
|
2075 |
-0.00023 |
0.66025776 |
|
2080 |
-0.00022 |
0.66603152 |
|
2085 |
-0.00016 |
0.64041555 |
|
2090 |
-0.00016 |
0.64802631 |
|
2095 |
-0.00013 |
0.63347734 |
|
2100 |
-0.00012 |
0.63985230 |
|
| The values for two coefficients can then be plotted by year, and are very close to a polynomial fit: |
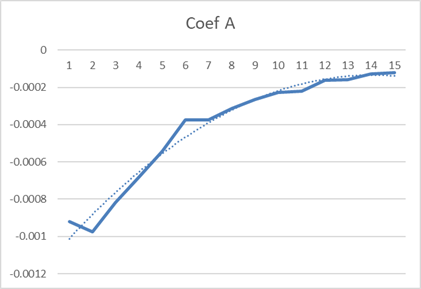 | 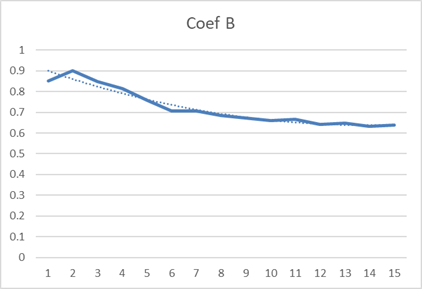 |
| Polynomial coefficients("A", "B", and "C") for the above "A" and "B" coefficients were derived |
|
|
A |
B |
C |
|
A |
-2.1E-07 |
0.000864732 |
-0.90603 |
|
B |
6.29E-05 |
-0.263486158 |
276.5668 |
|
| The formula for calculating the "Climate Factor" (or "CF", the ratio of the temperature increase to the total radiative forcing) then becomes: |
CF = (-2.07932167252698E-07 * YEAR * YEAR + 0.000871260688455337 * YEAR - 0.912804514777875) * CO2PPM + (0.0000636483061382873 * YEAR * YEAR - 0.266585156783745 * YEAR + 279.779588212216)
|
| A graph of the "Actual and Calculated Temperature/RF Ratio" shows that the formula works reasonably well |
 |
| The spreadsheet used to derive the formula can be downloaded by clicking here. |
|
|
|
- The temperature increase after changes to both CO2 and Non-CO2 emissions are taken into account
- Calculated: Either 'Temp Incr Goal' or Temp Incr (based on RF) - temp change from SRM using the formula "Value for SRM (in W/m-2) * Climate Sensivity * 0.26964486;
|
|
- The temperature increase after changes to both CO2 and Non-CO2 emissions are taken into account
- Calculated: Either 'Temp Incr Goal' or Temp Incr (based on RF) - temp change from SRM using the formula "Value for SRM (in W/m-2) * Climate Sensivity * 0.26964486;
|
|
- The radiative forcing from changes in the Earth's albedo (in W/m-2).
Albedo is a term used to describe the reflectivity
of a surface or body, specifically how much sunlight (solar radiation) is
reflected by that surface compared to how much is absorbed. It is expressed as a
percentage or a value between 0 and 1, where:
- Albedo of 0 means no reflection (complete absorption of
sunlight).
- Albedo of 1 means perfect reflection (no absorption of
sunlight).
In other words, a surface with high albedo reflects most of the sunlight that
hits it, while a surface with low albedo absorbs most of the sunlight. Albedo is
an important concept in climate science because it directly influences the
Earth's energy balance and temperature. (source: ChatCPG)
- User can enter values
|
|
Additional Information |
Factors Affecting Albedo:
-
Surface Type:
- Snow and Ice: Snow and ice have high albedo (typically around
0.8 to 0.9), meaning they reflect most of the sunlight. This is why regions with
ice and snow (like the polar regions) help to cool the Earth by reflecting solar
radiation.
- Water: Water has a lower albedo, especially when the sun is
directly overhead (around 0.06 for the ocean). Water absorbs much of the
sunlight that hits it, which helps warm the Earth's surface.
- Forests and Vegetation: Forested areas and vegetation have
moderate albedo, typically between 0.1 and 0.2, depending on the type of plants
and the density of the cover.
- Deserts and Sand: Sandy areas or deserts typically have higher
albedo (around 0.3 to 0.4) because the light-colored sand reflects a significant
portion of sunlight.
- Urban Areas: Cities often have a lower albedo due to asphalt,
buildings, and other materials that absorb more sunlight and heat up faster than
natural surfaces.
-
Surface Condition:
- Fresh Snow has a higher albedo compared to older, dirty snow.
As snow ages and accumulates dirt, soot, or black carbon, its albedo decreases,
leading it to absorb more heat.
- Clouds: Clouds reflect a large amount of sunlight, especially
thick clouds. The albedo of clouds can vary depending on their type, thickness,
and altitude.
-
Angle of the Sun:
- The angle at which sunlight hits a surface also affects its
albedo. When the sun is directly overhead (like at the equator), the albedo is
often lower because sunlight is more concentrated. When the sun is at a lower
angle (like at higher latitudes), the albedo is higher because sunlight is
spread over a larger area.
Albedo and Climate Change:
Albedo plays a critical role in climate regulation and can
influence the Earth's temperature in the following ways:
-
Positive Feedback Loop:
- In regions where snow and ice are abundant (such as the Arctic), the high albedo
helps reflect sunlight and cool the region. However, as temperatures rise due to
global warming, ice and snow melt, revealing darker surfaces (such as ocean
water or land) that have a lower albedo.
- This leads to more absorption of sunlight and faster
warming, creating a positive feedback loop. The more
ice and snow that melt, the more heat is absorbed by the Earth's surface, which
accelerates warming and leads to even more ice loss.
-
Global Warming:
- Reduction of Ice Cover: As the Earth's temperature increases,
particularly in the Arctic, the loss of ice decreases the
planet's overall albedo, leading to a feedback loop that accelerates warming.
This is a major factor in Arctic amplification, where the
Arctic warms at a much faster rate than other parts of the world.
- Deforestation and Land Use Changes: Changes in land use, such
as deforestation, can reduce albedo by replacing reflective forests with darker
surfaces (like urban areas or agricultural land), leading to local temperature
increases.
-
Geoengineering:
- Some geoengineering proposals aim to modify albedo to mitigate
climate change, such as by spraying reflective aerosols into the stratosphere
(to mimic the cooling effect of volcanic eruptions) or by enhancing the
albedo of surfaces like rooftops or deserts to reflect more sunlight.
Albedo and Earth’s Energy Balance:
Albedo is directly related to the Earth's energy balance. If
the Earth absorbs more energy than it reflects, it warms up. Conversely, if the
Earth reflects more energy than it absorbs, it cools down. Changes in
albedo—whether due to changes in ice cover, vegetation, or human activities—can
significantly affect this balance and thus influence global and regional
climates.
Summary:
Albedo is a measure of how much sunlight is reflected by a surface. Surfaces
like snow and ice have high albedo and help cool the planet, while surfaces like
oceans and forests have lower albedo and absorb more heat. Albedo has a profound
effect on global climate and contributes to feedback
mechanisms that can accelerate climate change. Reducing albedo in polar
regions by melting ice or increasing albedo in urban environments can
significantly influence local and global temperatures.
(source: ChatGPT)
|
|
| Temperature Increase from RF with Albedo (Includes 'Albedo Adjustment in 2023') |
|
- Additional Albedo (for analysis)
|
|
- The total radiative forcing (in W/m-2)
- Calculated: Sum of all the above RFs
|
|
- The ratio of the change in temperature to the change in radiative forcing for the specific year - the "radiative forcing factor" (RFF)
|
|
- The temperature increase after adjusting for the CDR needed to meet the 2100 temperature goal
- Disabled for now
|
|
- An estimate of the size of the temperature spikes in 2023 and 2024 that was not due to natural variation and is not included in climate models - i.e., the permanent temperature increase that needs to be added to the temperature projections of climate models
- User can enter value
|
| Temperature Increase With CDR |
|
- The ratio of the change in temperature to the change in radiative forcing for the specific year - the "radiative forcing factor" (RFF)
|
|
- Climate feedbacks refer to processes that can amplify or dampen the effects of climate change. These feedbacks are mechanisms that occur as a result of the changing climate itself and either reinforce or mitigate the initial changes caused by human activities, such as the burning of fossil fuels. (source: ChatGPT)
- User can enter values
|
|
Additional Information |
|
(source: ChatGPT)
|
|
|
- Carbon removal refers to all human derived techniques/process that remove CO2 from the atmopshere (CCS, DAC, mineraliation, etc.)
- User can enter values
|
|
- Total Net CO2
- Calcuated: The sum of all CO2 emissions and removals
|
|
- The amount of CO2 added to the atmosphere in 'parts per million' (PPM)
- Calculated: CO2 To Atmosph/7.81
|
|
- The atmospheric concentration of CO2
- Calculated: Previous years's PPM +PPM Added to the atmosphere
|
|
- The radiative forcing of CO2 (in W/m-2)
- Calculated: log(CO2 PPM / PreIndustrial PPM) * 5.35
|
|
Additional Information |
|
(source: ChatGPT)
|
|
|
- The total radiative forcing (in W/m-2)
- Calculated: Sum of all the above RFs
|
|
- The temperature increase goal (user input)
- User can enter values
|
| Temperature Increase With SRM - Based on RF reduction per year until temperature target met |
|
- The ratio of the change in temperature to the change in radiative forcing for the specific year - the "radiative forcing factor" (RFF)
|
|
- The amount of 'solar radiation management' either required as specified directly by the user or calculated from the temperature increase goal
- User can enter values
|
|
- The total radiative forcing (in W/m-2)
- Calculated: Sum of all the above RFs
|
|
- The temperature increase after the 'solar radiation management' is taken into account
- Calculated: Either 'Temp Incr Goal' or Temp Incr (based on RF) - temp change from SRM using the formula "Value for SRM (in W/m-2) * Climate Sensivity * 0.26964486;
|
| Temperature Increase With SRM - Based on Temperature Reduction Per Airplane Per Year |
|
- Sea Level Rise Per °C
- The user can enter values.
|
|
- Cost per ton sequestered by
- User can enter values
|
|
- Annual costs of disasters
- The user can enter values. The model initializes the cost of disasters to $300 Billion in 2100 for the most aggressive mitigation scenario and to $750 Billion in 2100 for the least aggressive scenario. This needs to be adjusted.
|
|
Additional Information |
Cost of Disasters
|
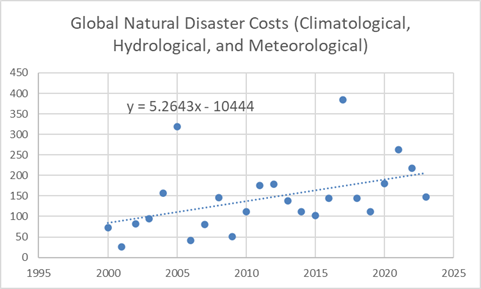
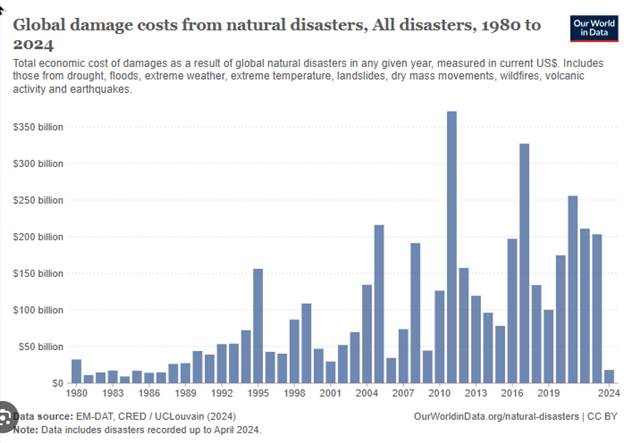
The annual costs for climatological, hydrological, and meteorological natural disasters for 2000 through 2023 were obtained from
The Centre for Research on the Epidemiology of Disasters (CRED)
(https://public.emdat.be/data) (see Figure 1). Linear projections of this data though 2100 were then made (see Table 1). |
 |
|
Year |
Projected Cost |
|
2025 |
216 |
|
2030 |
243 |
|
2035 |
269 |
|
2040 |
295 |
|
2045 |
321 |
|
2050 |
348 |
|
2055 |
374 |
|
2060 |
400 |
|
2065 |
427 |
|
2070 |
453 |
|
2075 |
479 |
|
2080 |
506 |
|
2085 |
532 |
|
2090 |
558 |
|
2095 |
585 |
|
2100 |
611 |
|
 |
|
Figure 1. Scatter plot of annual natural disaster costs. |
Table 1. Linear projections of this data though 2100 |
Figure 2. Total costs of all natural disasters |
|
|
|
|
|
| Cost Calculations (Without Albedo) |
|
- The user can enter values.
|
|
- The user can enter values. The model initializes the cost of disasters to $300 Billion in 2100 for the most aggressive mitigation scenario and to $750 Billion in 2100 for the least aggressive scenario. This needs to be adjusted.
|
|
- Annual cost carbon dioxide removal for CCS
- Disabled for now
|
|
- Annual cost carbon dioxide removal for DAC
- Disabled for now
|
|
- The user can enter values. The model initializes the cost of disasters to $300 Billion in 2100 for the most aggressive mitigation scenario and to $750 Billion in 2100 for the least aggressive scenario. This needs to be adjusted.
|
|
- Cost per ton sequestered by CCS
- Disabled for now
|
|
- Cost per ton sequestered by DAC
- Disabled for now
|
| Cost Calculations (With Albedo) |
| Cost Calculations (With Albedo and CDR) |
|
- Carbon removal refers to all human derived techniques/process that remove CO2 from the atmopshere (CCS, DAC, mineraliation, etc.)
- Calculated:
|
|
- Sea level rise
- The user can enter values.
|
|
- Annual costs of sea level rise
- The user can enter values. The model initializes the cost of disasters to $300 Billion in 2100 for the most aggressive mitigation scenario and to $750 Billion in 2100 for the least aggressive scenario. This needs to be adjusted.
|
|
- Annual cost carbon dioxide removal for DAC
|
|
- Average annual cost carbon dioxide removal all CDR
- Calculated: Total Carbon Removal * Carbon Removal cost/ton
|
|
- Annual costs of disasters
- The user can enter values. The model initializes the cost of disasters to $300 Billion in 2100 for the most aggressive mitigation scenario and to $750 Billion in 2100 for the least aggressive scenario. This needs to be adjusted.
|
|
Additional Information |
Cost of Disasters
|
The annual costs for climatological, hydrological, and meteorological natural disasters for 2000 through 2023 were obtained from
The Centre for Research on the Epidemiology of Disasters (CRED)
(https://public.emdat.be/data) (see Figure 1). Linear projections of this data though 2100 were then made (see Table 1). |
|
|
|
Year |
Projected Cost |
|
2025 |
216 |
|
2030 |
243 |
|
2035 |
269 |
|
2040 |
295 |
|
2045 |
321 |
|
2050 |
348 |
|
2055 |
374 |
|
2060 |
400 |
|
2065 |
427 |
|
2070 |
453 |
|
2075 |
479 |
|
2080 |
506 |
|
2085 |
532 |
|
2090 |
558 |
|
2095 |
585 |
|
2100 |
611 |
|
|
|
Figure 1. Scatter plot of annual natural disaster costs. |
Table 1. Linear projections of this data though 2100 |
Figure 2. Total costs of all natural disasters |
|
|
|
|
|
|
- Annual total costs of disasters, CDR, etc.
- User can enter values
|
|
- The amount of 'solar radiation management'specified for the scenario
- From original scenario
|
|